
In the modern world of information technology, it is all about visuals. If you think about it, the most used and sought forms of media are all highly dependent on video material. From movies and TV shows to video games and social media content creation, the visualization part is always crucial. We have entered an era in which it is of the utmost importance for anything to be visually pleasing and interesting to look at if we want it to pass the enjoyment and fun test and be successful.
With all of that being said, it can also be concluded that because of such a wide need for video content, the tools for such design and visualizations are also very much in demand. However, the best and most complex of them are usually reserved for professional editors and video designers and have a very high learning curve. Rarely is there a useful tool for amateurs who are looking to do something simple and quick, but they do exist.
Since video and image editing as well as presenting content to people is something all of use need sooner or later, we have to know about these tools if we are to try them out and complete our projects. In this article, we are going to help you by introducing some of the best easy-to-use design and visualization tools you should try in 2024. If you are looking for a quality tool for all of your different designs and projects no matter what they are, make sure to check out futureon.com and browse their offer.
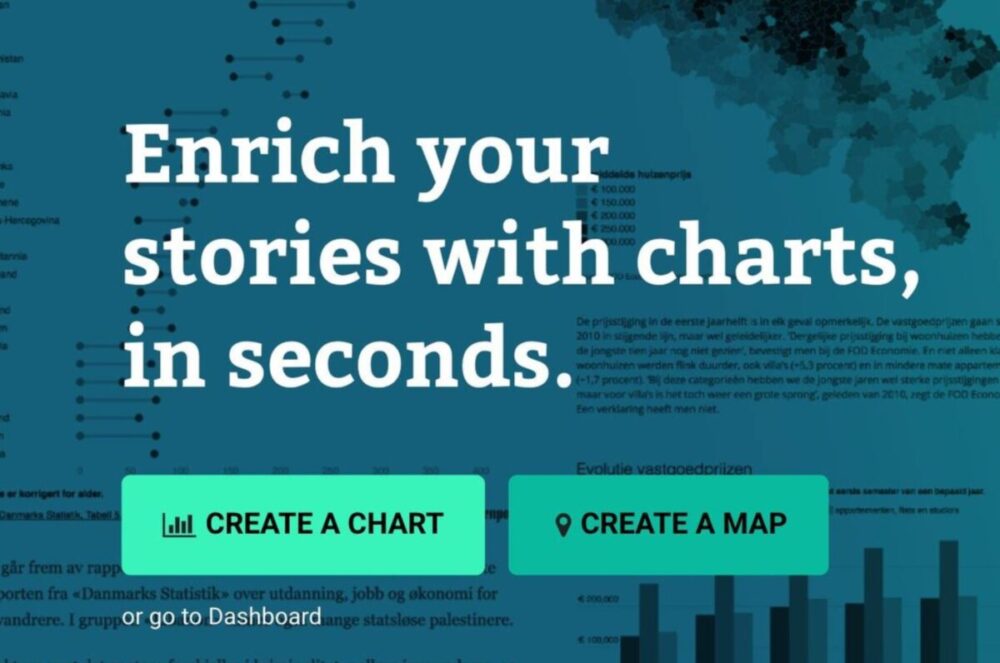
1. Flourish
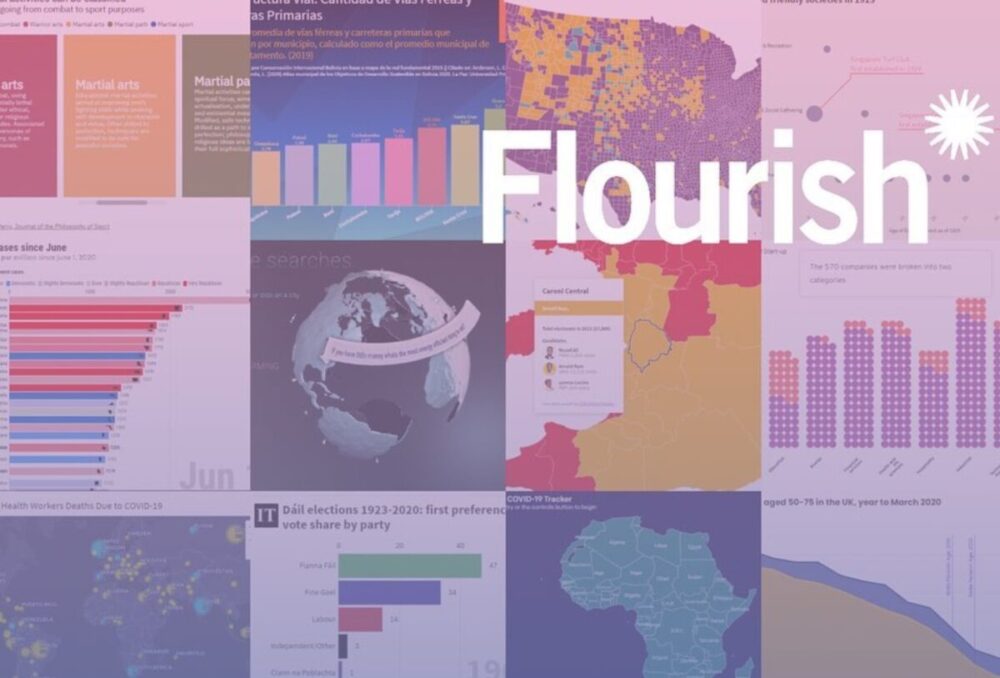
We start things off with a good choice for any type of chart, map, or interactive story for your visualization needs. As straightforward and easy to use as it can possibly be, this tool contains a rich library of templates that will be more than enough despite the complexity and size of your task. The different visualization options it offers will surely be sufficient and you will love using them and trying new things with each coming project. If you are in constant need of storytelling with your data, you will hardly find a better solution. The free version is good enough as it allows you to use some of the best features including bar races, carousels, and quizzes. Also, you can create simple yet immersive scroll stories and many of the best visualization options. However, you cannot keep what you upload private as it become public. If you get the full version, it is a much better experience.
2. DataWrapper
Next up on the list of our easy-to-use tools for any form of design and visuals is DataWrapper, a program that gives you a chance to make interactive maps, charts, and tables. You hardly need any other skills or knowledge because it is so easy and simple to navigate. Whatever you make with it is readable on any other device, making this a very useful tool if ever have the need to jump from one gadget and system to another. This solution is made with creative bloggers, vloggers, journalists, and writers in mind, and anyone else who needs a good tool for design but not something top-tier and professional-grade. The free version allows you to connect to Google Sheets and CSV, but you can only export PNG files. You can however create and publish an unlimited amount of charts, maps, and tables, which is good enough for most users. Paid plans can be pricey since they start at around €500 per month.
3. Chartblocks
As the name suggests, the third tool on our list is mostly reserved for charts. It is a part of cloud design platforms by the name of Ceros, which is made for designers and marketers who need immersive and engaging content without any form of coding. The coding side prevents a lot of talented people who are not interested in programming languages from ever creating what they dream of. This is where Chartblocks comes in with its quick and easy interface. A few minutes is all you need to make a great-looking chart, bar, line, scatter, or pie. A free account is necessary though, but you are used to that by now surely. Chartblocks is made for anyone who needs great visualization options in as little time as possible. The free version available gives you all the simplicity you can ask for as well as private charts. However, you can only have up to 50 active charts and only 50,000 views per month, both of which are not suitable for many users. Furthermore, CSV and Excel files are able for upload and the max size per file is 50 MB.
4. Infogram
The fourth and last easy-to-use design and visualization tool we recommend you to try in 2024 is called Infogram and it is a wonderful way to make pretty and pleasing content. Except the usual designs like pie charts, lines, and bars, you can also make reports and infographics, hence the name. For a more informative approach to your content creation, this may be a better solution than some of the other ones on our list. They are more on the side of simple visuals, while this gives you the chance to include for info and more data. Make no mistake though and believe that the animations are poor. Not at all, since you can zoom, flip, fade, bounce, and slide the elements you introduce as much as you need. Graphics and shapes are also there, as well as other elements to make your project better-looking. If you do go with the free version though, you will only be able to create 10 projects, each with a modest amount of only 5 pages. Only 13 map types out of the possible 550 are available in the free version, and all of your data will be public. Lastly, you will have no live data or data connection unless you opt for the full, paid variety.